The Four Mechanics Behind Your LLM Bill
Why the rate card doesn't predict what you pay
All figures are illustrative estimates from a hypothetical scenario, using published Anthropic rates as of July 2026. Your numbers will differ.
Consider a CV screener: it takes a résumé, extracts structured fields, scores the candidate against a role, and writes a short justification.
Nothing exotic. This is what an LLM feature looks like inside any HR product.
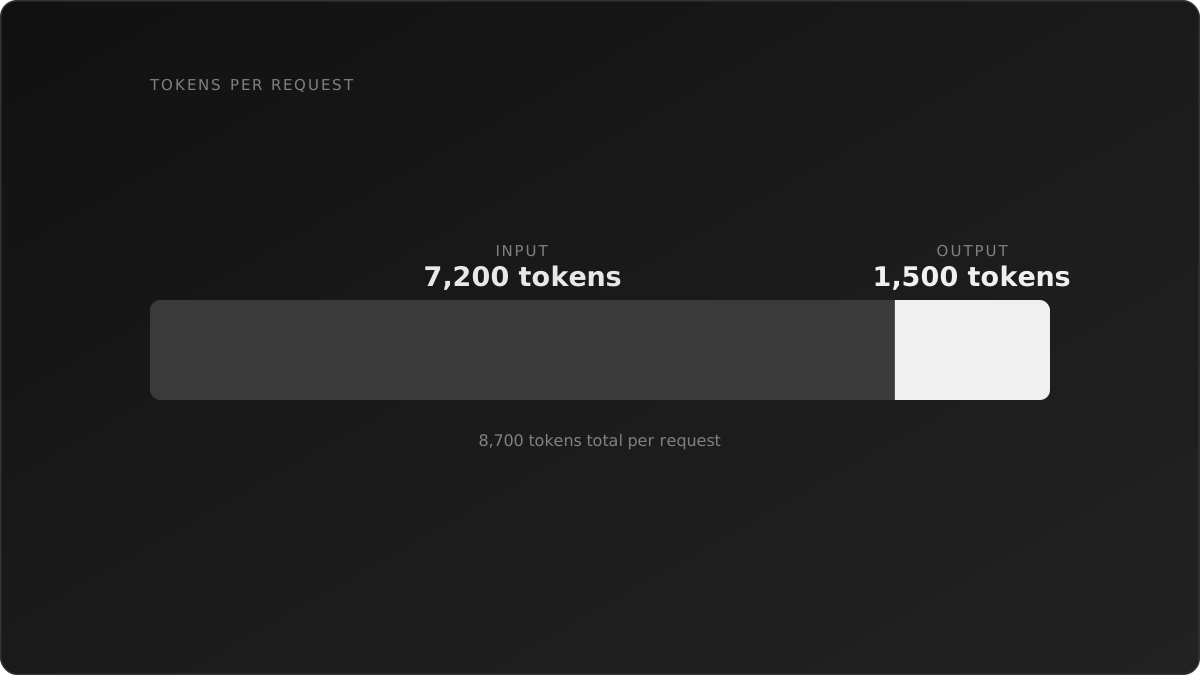
At 1,000 CVs a day on Opus 4.8:
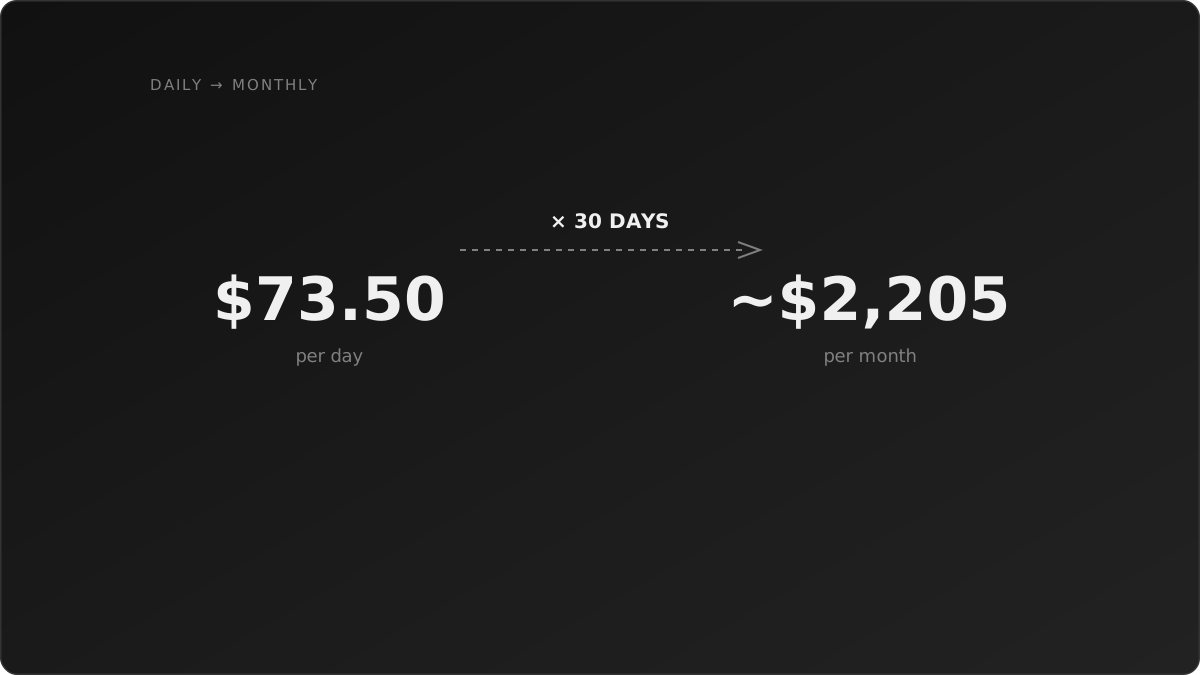
$2,205 a month. That's the number the rate card gives you. Hold onto it.
01 — Cache Break-Even
The problem
The Claude API is stateless. Every request is independent, so you resend everything, every time.
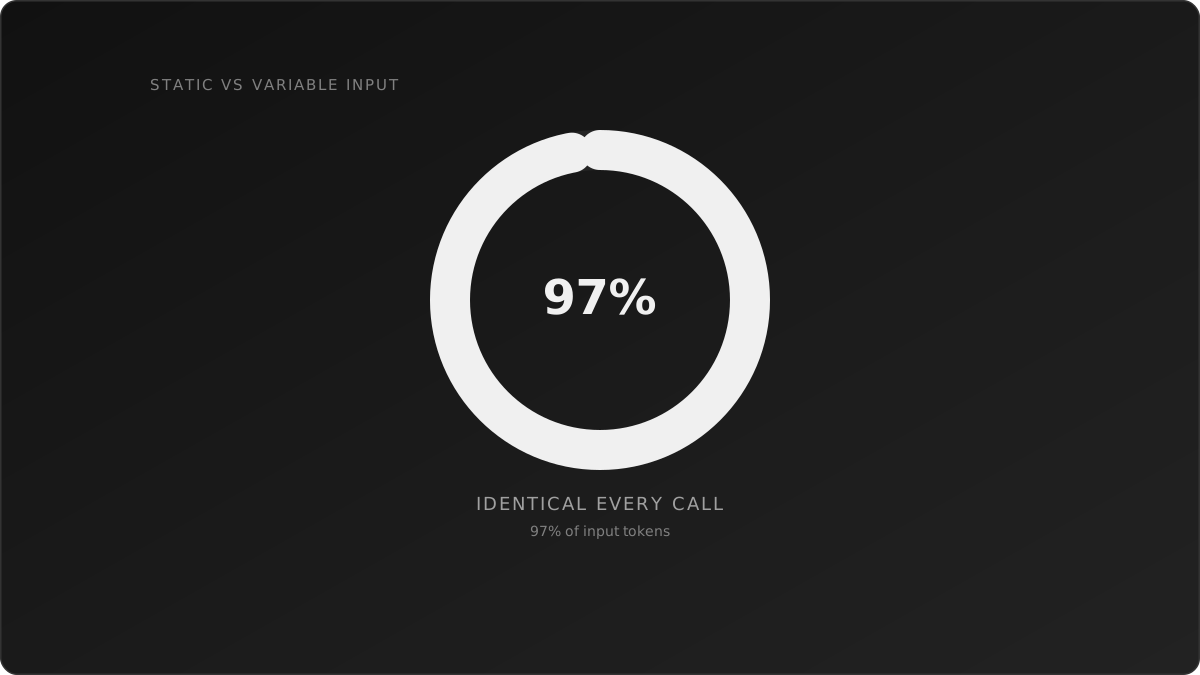
97% of your input is the same text on every request. At 1,000 CVs a day that's $35/day for text Anthropic has already read 999 times.
The solution
Prompt caching tells Anthropic: this prefix never changes, store it processed, reuse it next time. You mark where the stable part ends:
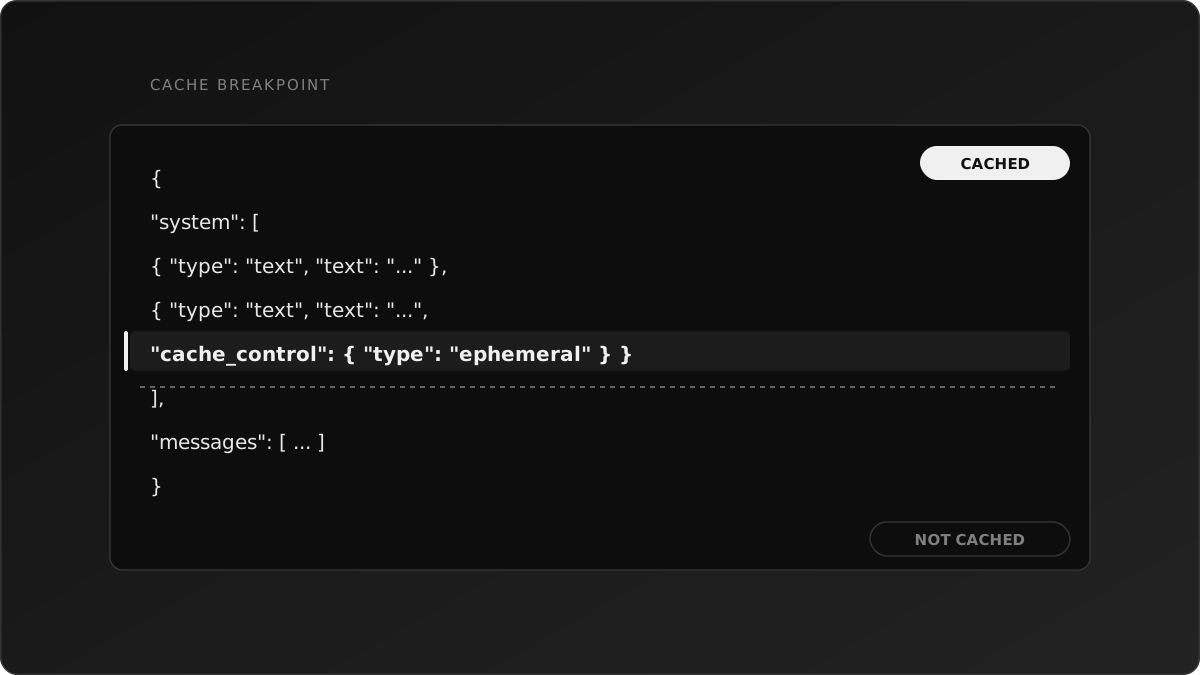
Everything above the breakpoint gets cached. Everything below is priced normally.
The trap
There isn't one cache price. There are three.
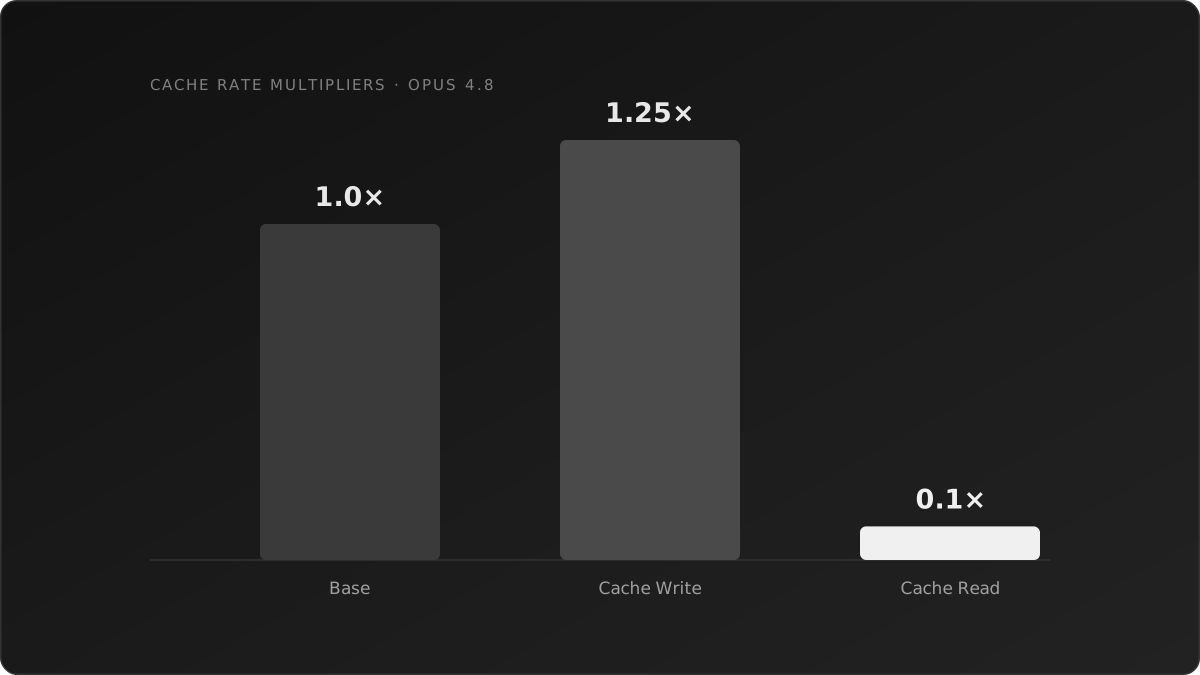
Writing the cache costs more than not caching. You pay a 25% premium once to pay 90% less afterward — an investment with a payback period, not a discount.
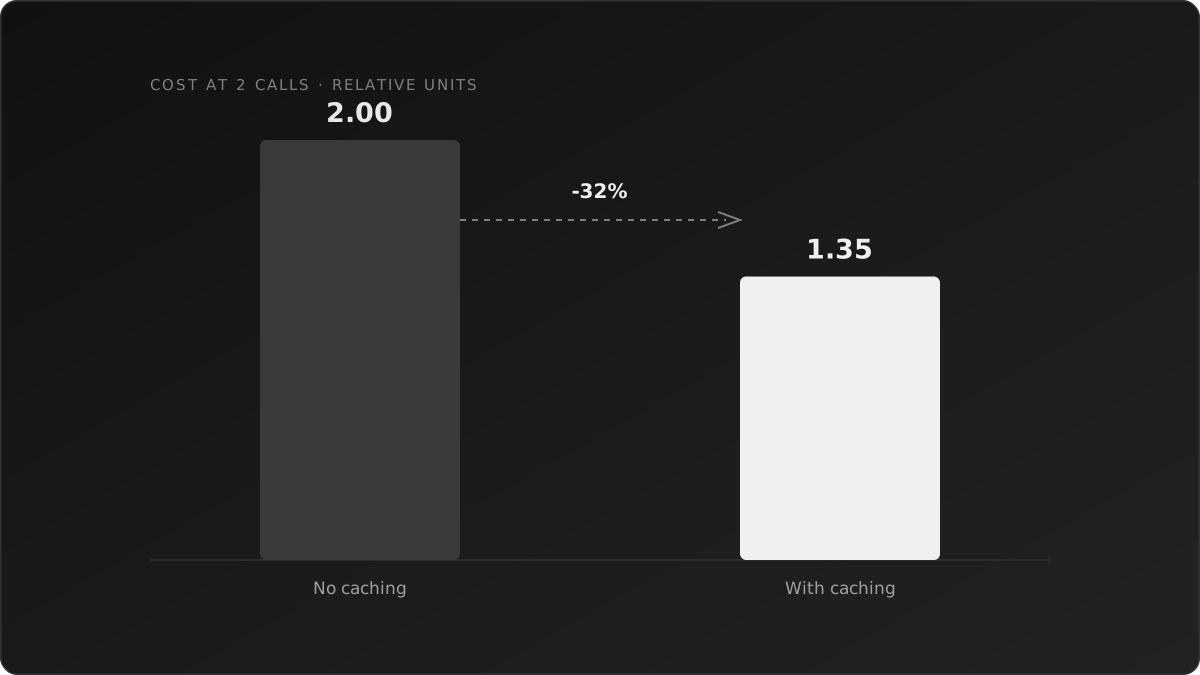
Three more worth knowing:
- The 1-hour cache costs 2.0× to write — it needs 3+ hits to pay off. At 2 calls it's worse than not caching.
- Anything variable above the breakpoint kills it. A
${new Date()}means zero hits and a 25% surcharge on every call. - The failure is silent. Check
response.usage.cache_read_input_tokens— if it stays at 0, nothing will tell you.
Back to the screener
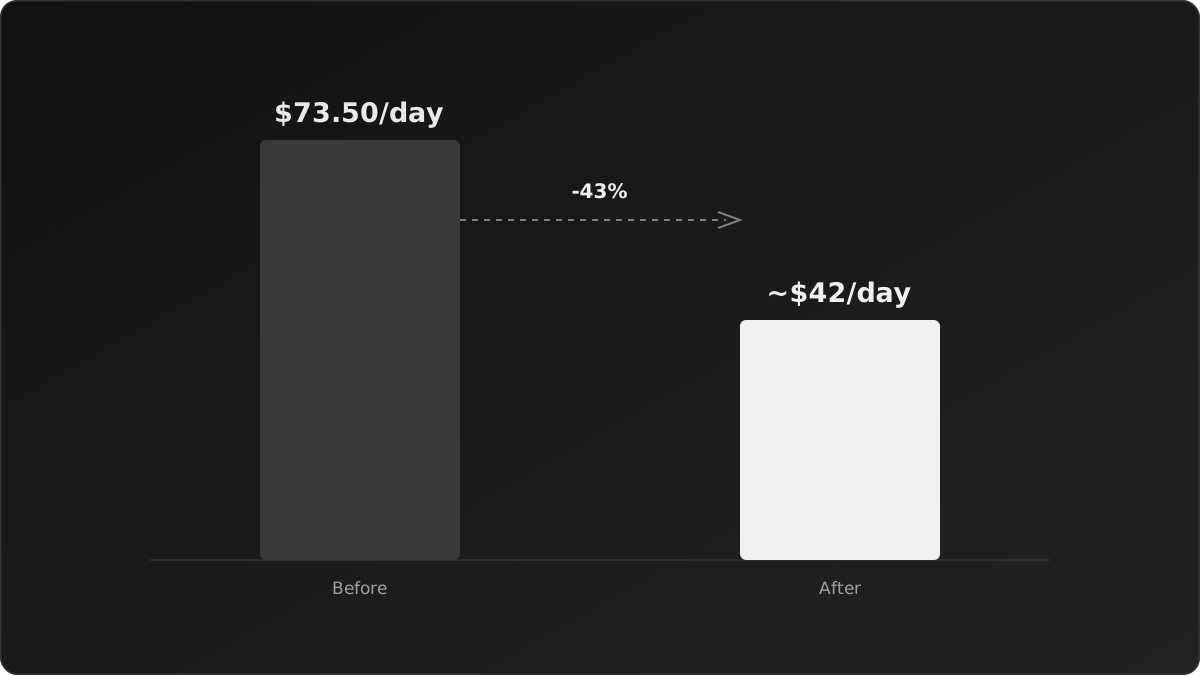
One line of config. 43% off the bill.
What's left: output is untouched at $37.50/day — now 89% of the total. That's Block 04's problem.
02 — Quadratic Resend
The problem
Block 01 assumed one call per CV. That's not how agents work.
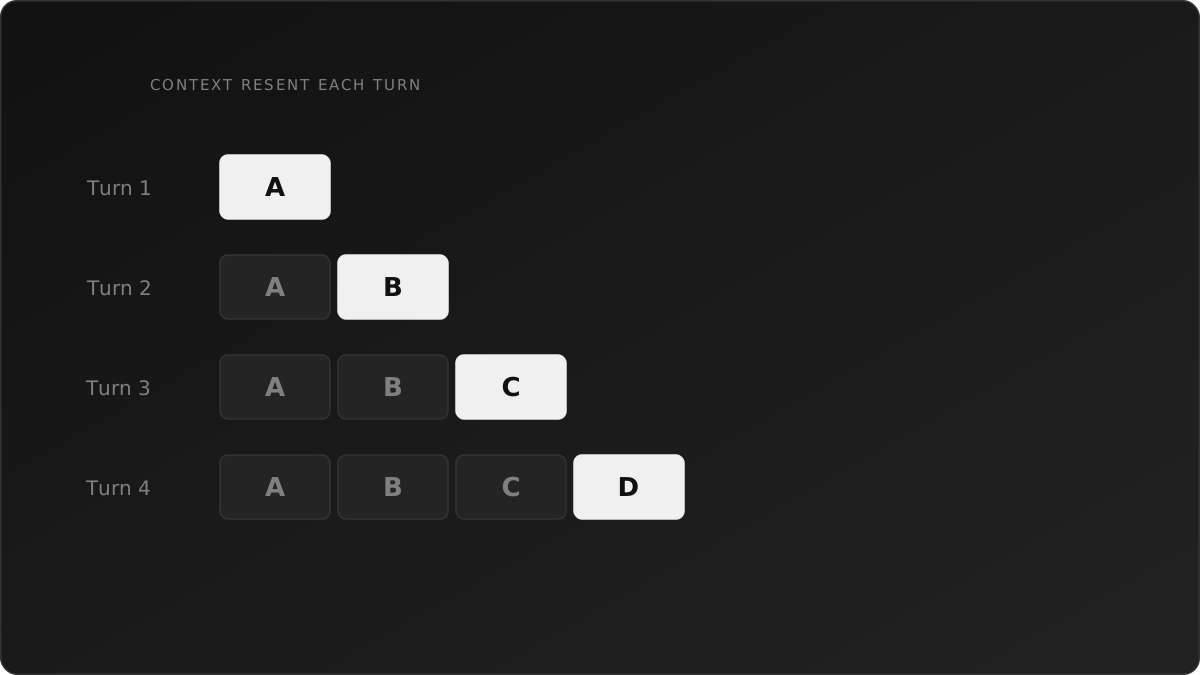
The moment your screener uses tools — fetch the role, query the ATS, look up salary bands — you're in a loop. And every turn resends the entire conversation.
The trap
Costs don't grow with the conversation. They grow with the square of it.
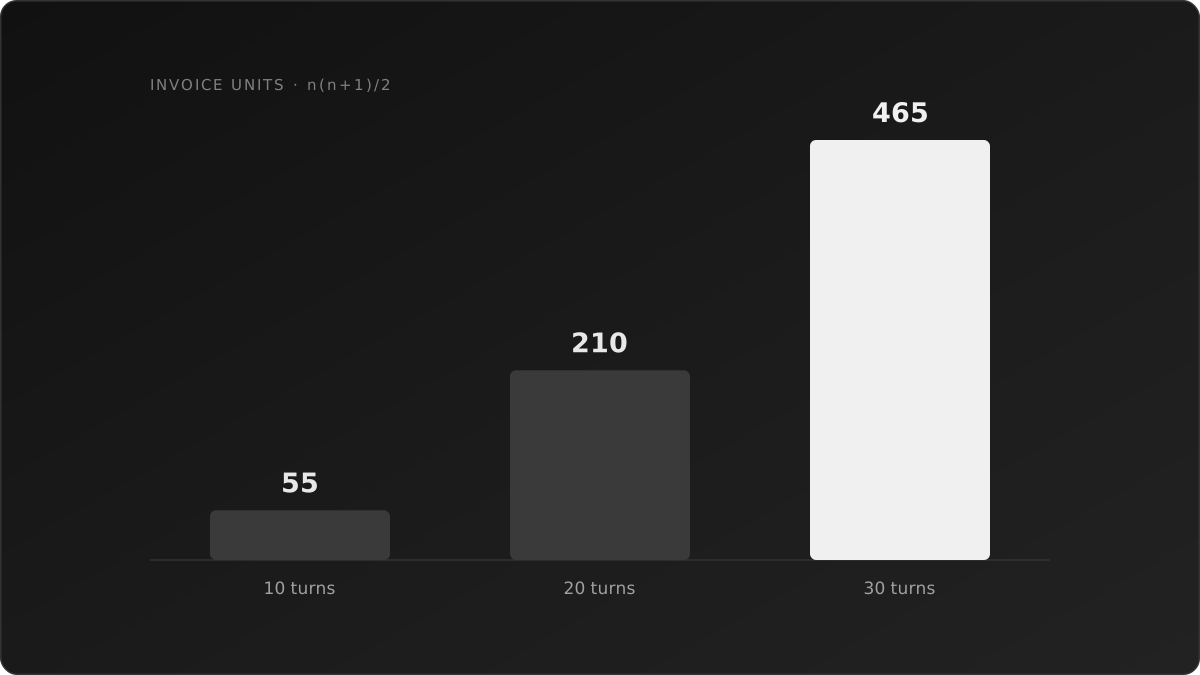
Ten turns of content, 55 units on the invoice. That's n(n+1)/2.
And the units aren't small. Tool results are the heaviest thing in an agent's context — a single ATS response can be 3,000 tokens of JSON, paid for on every subsequent turn.
- Thinking tokens count too — extended thinking stays in context and gets resent at input rates.
- This is usually the dominant cost in agent work, not the model tier. Teams downgrade Opus to Sonnet and wonder why the bill barely moves.
Back to the screener
Same base, now a 15-turn agent averaging 1,500 tokens of tool results per turn:
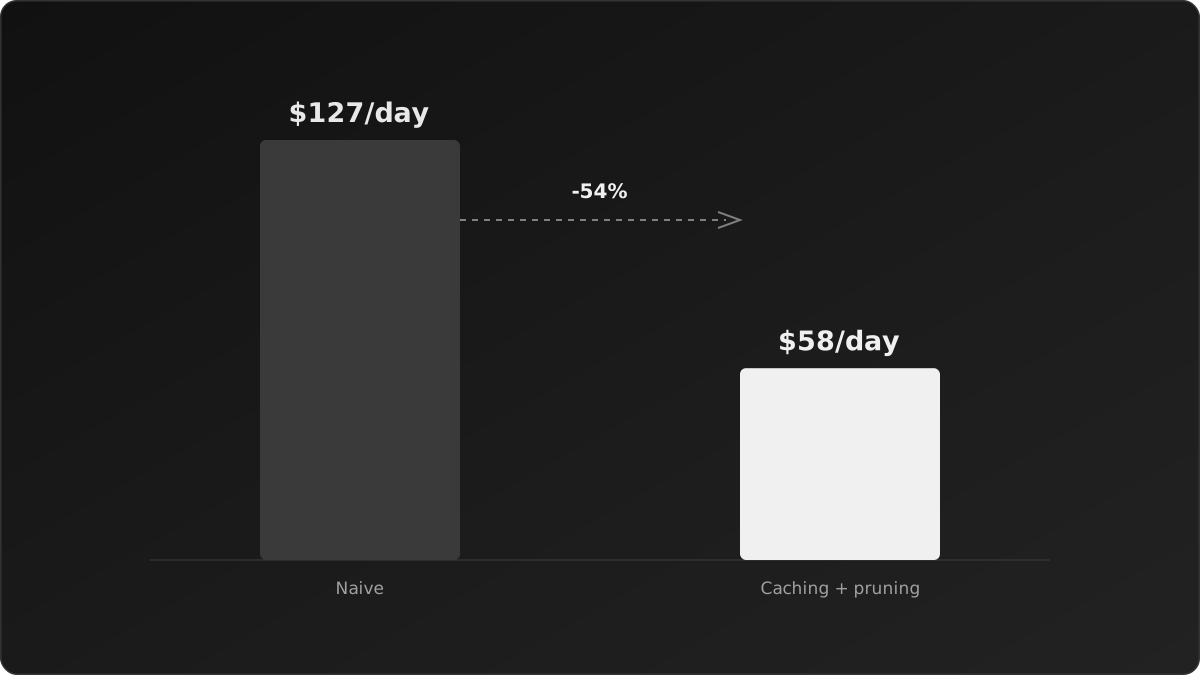
These swing widely with how much your tool results weigh. Two things fix it: cache the stable prefix and prune tool results you're done with. A salary lookup from turn 3 doesn't need to be in context on turn 14.
03 — Tokenizer Drift
The problem
You don't pay per character. You pay per token — and how text splits into tokens is a property of the model, not of your text.
The trap
Anthropic changed the tokenizer in Opus 4.7. Same text, up to 35% more tokens.
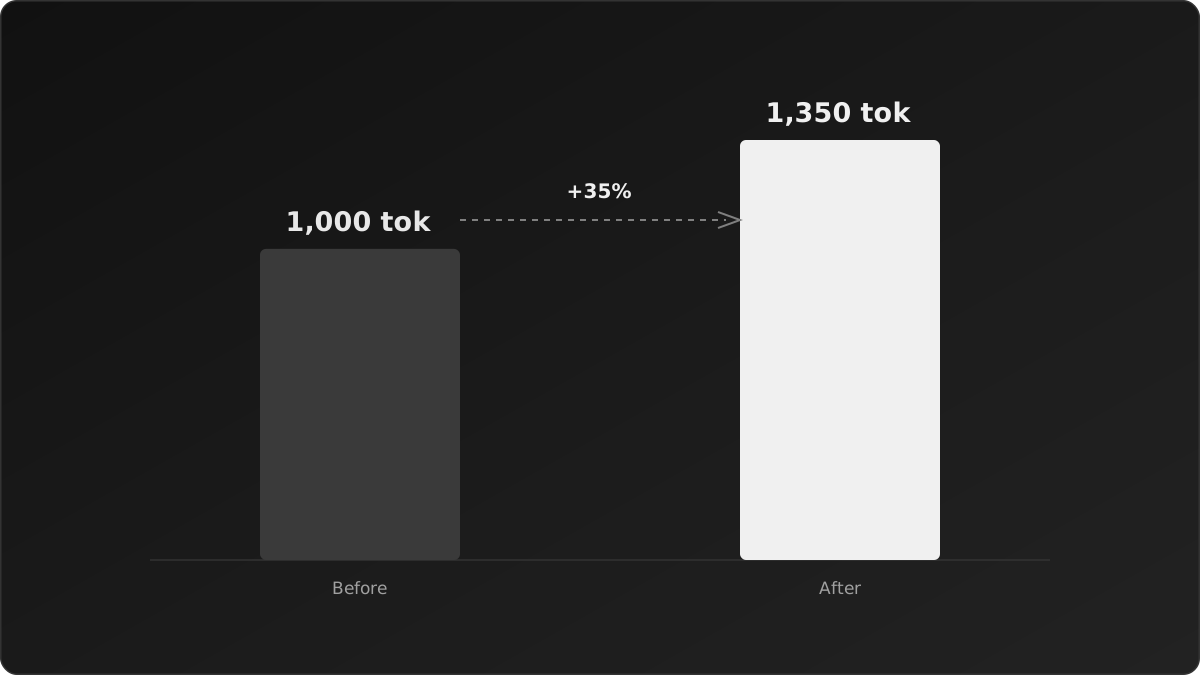
The rate card says $5.00/MTok in both cases. Your bill goes up 35% anyway.
Everyone compares models by price per million tokens. Nobody asks how many tokens the same text produces. It's an invisible variable that breaks every price comparison.
- It hits Spanish, code, and proper nouns hardest — exactly where tokenizers differ most.
- Migrations are where it bites. You upgrade for quality and inherit a cost increase nobody mentioned in the changelog.
Back to the screener
Before switching versions, run 50 real CVs through both and compare usage.input_tokens. Twenty minutes, and it's the only way to know what a migration costs.
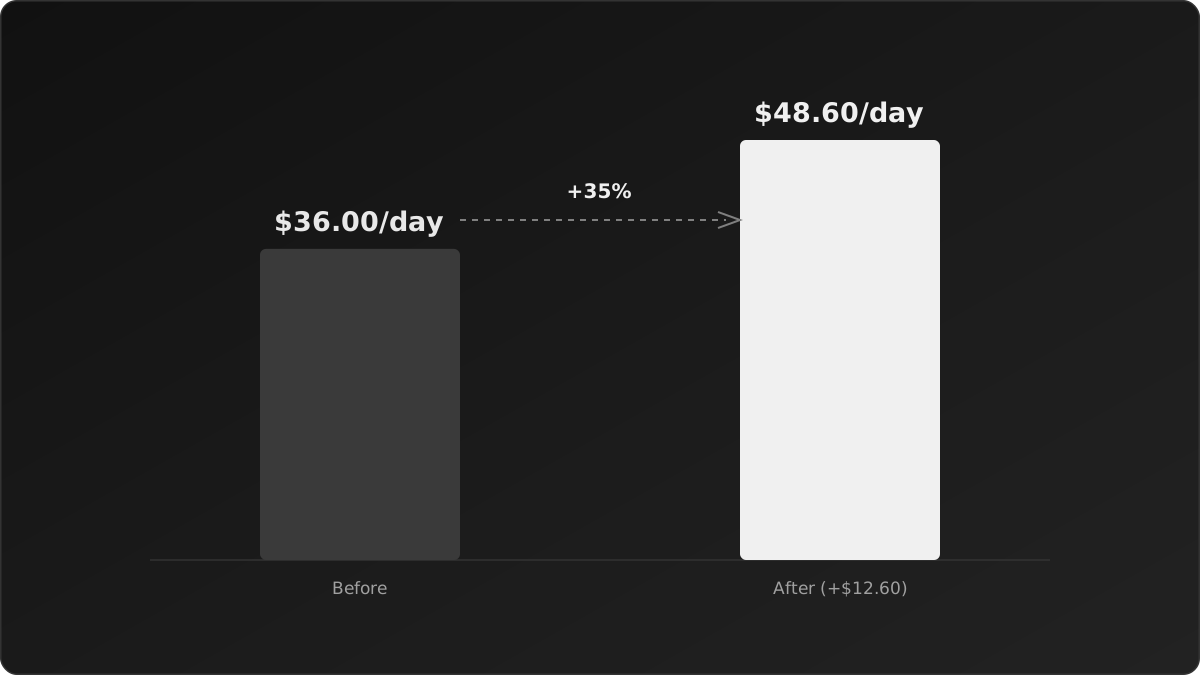
$380/month for changing a version string.
04 — The 5× Rule
The pattern
Across every workhorse tier, output costs exactly 5× input.
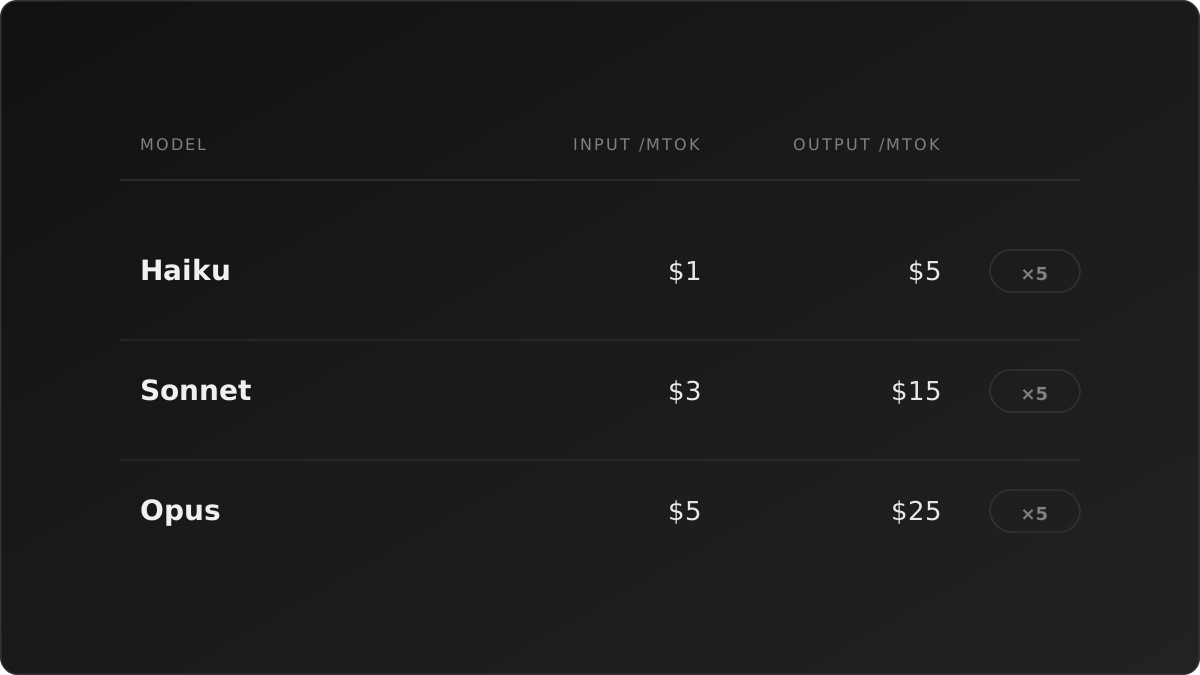
Know your input price, multiply by five. That's the whole rule.
The trap
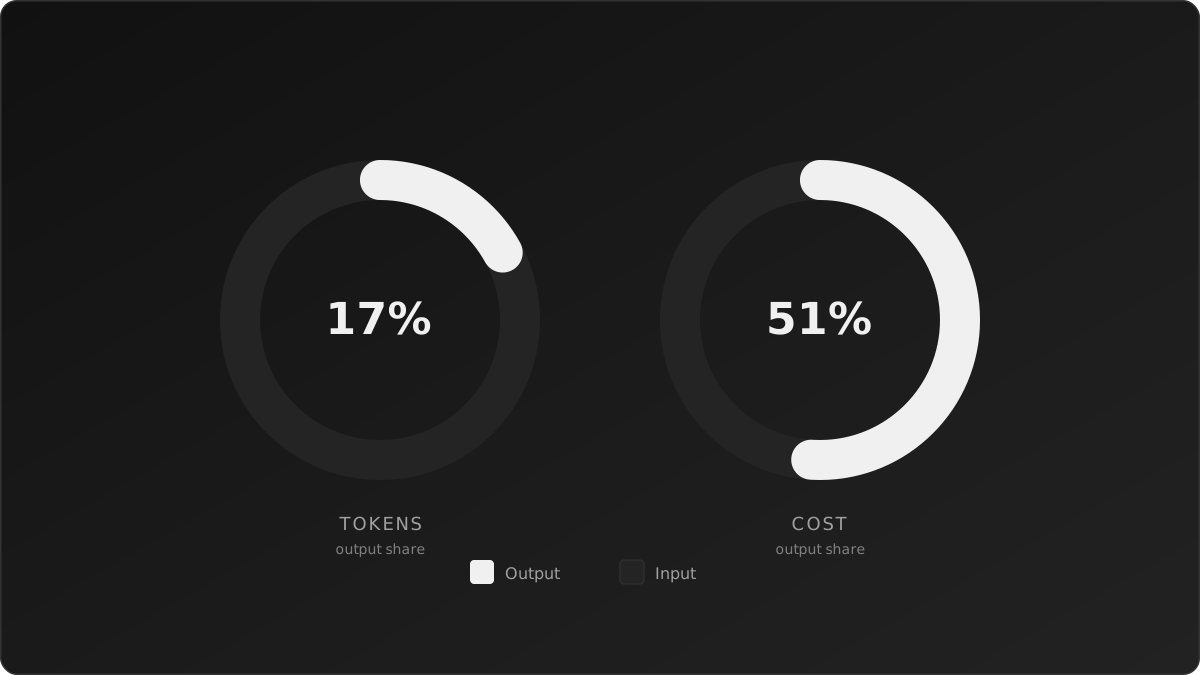
Output is 17% of your tokens and 51% of your bill.
This inverts where you optimize. Everyone trims the prompt. But cutting 100K input tokens saves $0.50 — cutting 100K output tokens saves $2.50. Output optimization pays 5× more.
- Thinking tokens bill as output. Extended thinking without a budget generates thousands of tokens at the most expensive rate on the card.
max_tokensis a cap, not a target — but a verbose prompt will fill it. "Write a brief justification" versus "write a thorough analysis" is a real line item.
Back to the screener
Ask for structured output instead of prose — a score, five fields, two sentences:
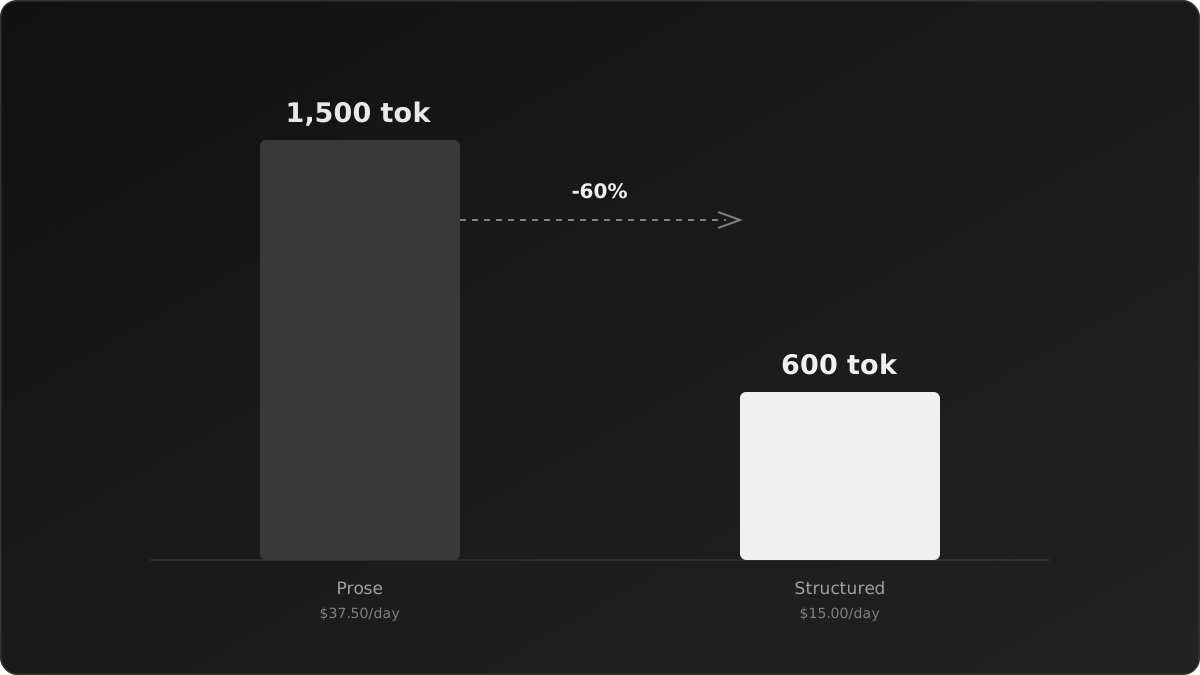
$675/month for a tighter output spec.
Where the bill actually landed
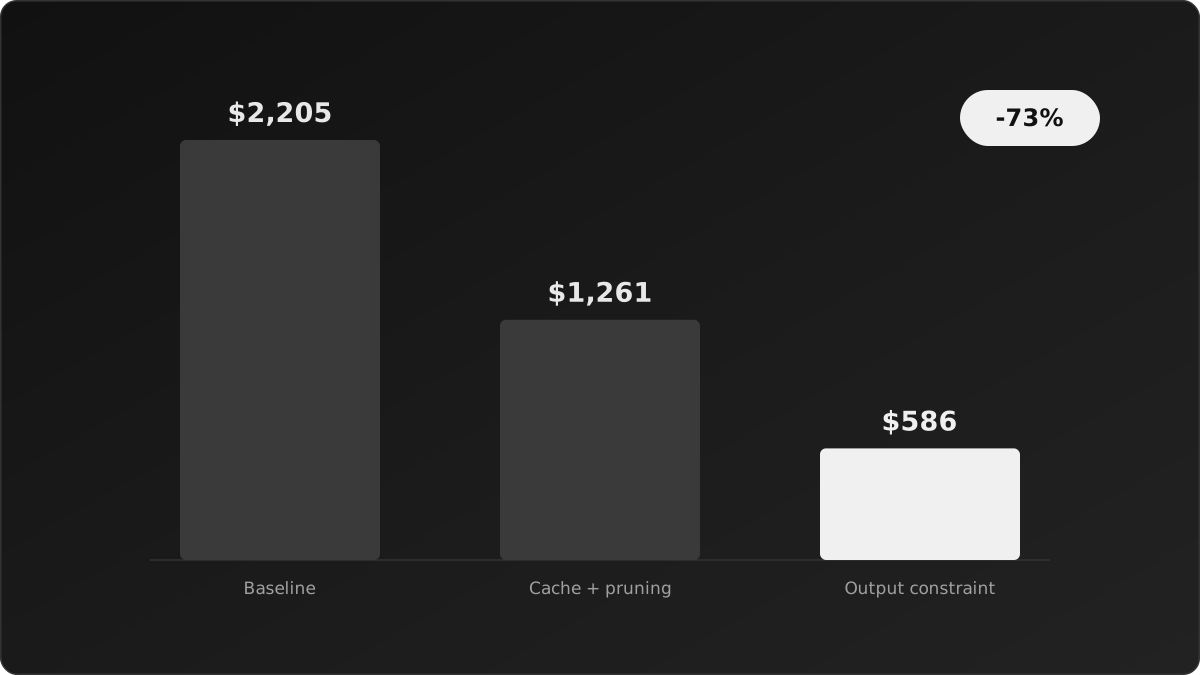
That's a 73% reduction in this scenario, and the model never changed. No downgrade, no quality tradeoff — just four mechanics the pricing page doesn't describe.
The order matters, and it's the answer to "how do you optimize LLM costs" in an interview:
- Pick the cheapest model that clears the quality bar — Haiku is 5× cheaper than Sonnet, 25× cheaper than Opus
- Constrain output — pays 5× more than trimming input
- Manage context — the dominant cost in agent loops
- Cache the stable prefix — 90% off what repeats
- Measure real tokens when you migrate — the rate card doesn't tell you
Four mechanics: when to cache, how much context you're dragging, how many tokens your text actually becomes, and which side of the bill you're on.
A note on the numbers
Everything here is a worked example, not a benchmark. The screener is hypothetical, the token counts are round numbers chosen to make the arithmetic legible, and the savings are what the arithmetic implies — not measured results from production.
Rates are Anthropic's published prices as of July 2026 and will change. Cache multipliers, tokenizer behaviour, and model pricing are documented by Anthropic and are the source of truth over anything here.
The point isn't the dollar figures. It's the four mechanics, which hold regardless of what the rate card says on the day you read this.